Table of Contents[Hide][Show]
How much does the tooth fairy pay these days?
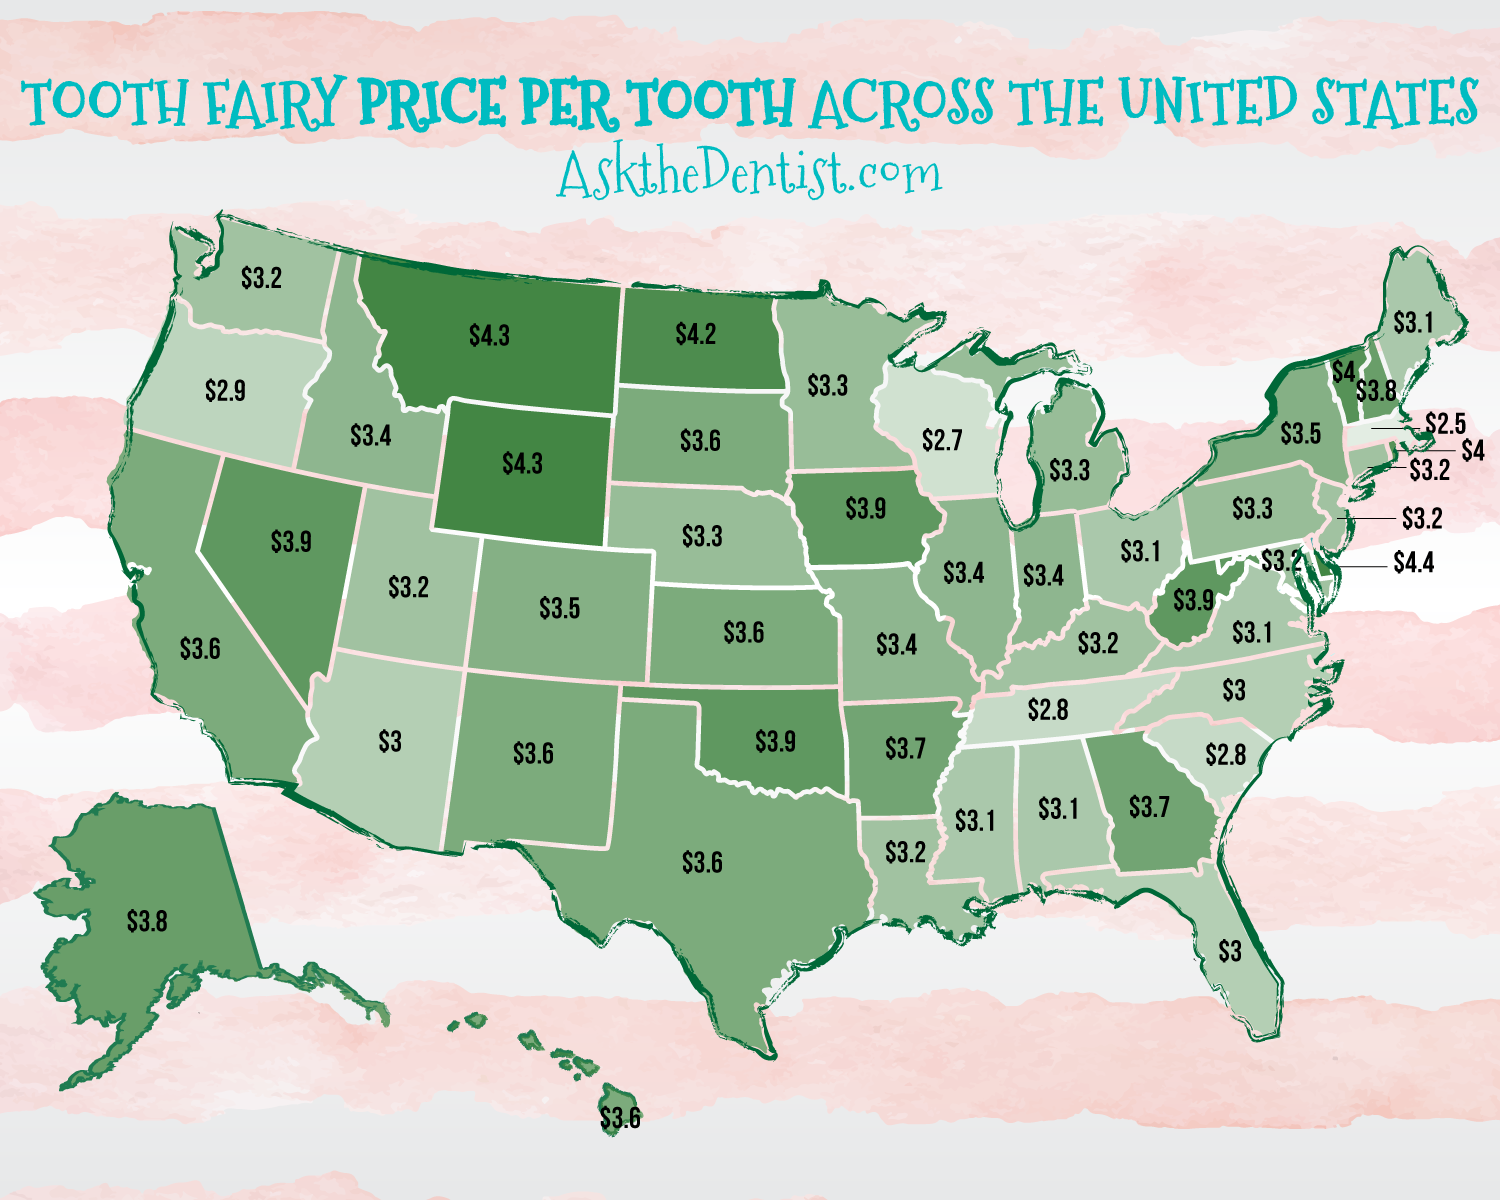
We decided to run a tooth fairy poll of over 1,700 parents in the United States to find out what the average going rate is for the tooth fairy in each of the 50 states.
Here’s what we found.
| State | Average Payout |
| Alabama | 3.08 |
| Alaska | 3.83 |
| Arizona | 2.97 |
| Arkansas | 3.72 |
| California | 3.61 |
| Colorado | 3.47 |
| Connecticut | 3.23 |
| Delaware | 4.46 |
| District of Columbia | 3.71 |
| Florida | 2.97 |
| Georgia | 3.7 |
| Hawaii | 3.57 |
| Idaho | 3.36 |
| Illinois | 3.41 |
| Indiana | 3.42 |
| Iowa | 3.91 |
| Kansas | 3.62 |
| Kentucky | 3.2 |
| Louisiana | 3.22 |
| Maine | 3.06 |
| Maryland | 3.2 |
| Massachusetts | 2.56 |
| Michigan | 3.33 |
| Minnesota | 3.29 |
| Mississippi | 3.12 |
| Missouri | 3.43 |
| Montana | 4.35 |
| Nebraska | 3.27 |
| Nevada | 3.93 |
| New Hampshire | 3.77 |
| New Jersey | 3.21 |
| New Mexico | 3.6 |
| New York | 3.53 |
| North Carolina | 2.97 |
| North Dakota | 4.15 |
| Ohio | 3.11 |
| Oklahoma | 3.86 |
| Oregon | 2.87 |
| Pennsylvania | 3.28 |
| Rhode Island | 4.02 |
| South Carolina | 2.75 |
| South Dakota | 3.62 |
| Tennessee | 2.8 |
| Texas | 3.56 |
| Utah | 3.25 |
| Vermont | 3.98 |
| Virginia | 3.12 |
| Washington | 3.23 |
| West Virginia | 3.86 |
| Wisconsin | 2.74 |
| Wyoming | 4.33 |
Sample details
Only US participants and only participants who are parents with children under the age of 13 we reenrolled in the survey. Participants were recruited from every US state with an average of 35participants recruited from each state. The sample has a fitting distribution across age categories for US parents with 15% ages 18-27, 56% ages 28-37, 24% ages 38-47, and 5% age 48 or older. Participants were also sampled with an equitable gender distribution with 46% male and 54%female respondents. The fastest 5% of the sample were removed before analysis to ensure data quality (as they may have sped through without paying attention) resulting in a final sample size of N=1,788. Participants were compensated at a rate at least equivalent to $15/hour.
Methodology
Participants were asked how much the tooth fairy currently leaves per tooth in their households. In order to arrive at a reliable estimate of the average price in each state, we used a linear mixed-effects regression model. This approach allows all information to be incorporated into each state’s price estimate with a degree of pooling based on the number of observations per state. This produces results quite similar to taking simple means of reported prices by participants in each state but is more reliable because it also incorporates information from prices reported by participants in other states in order to stabilize estimates. In the figure directly below you can see how these two approaches to estimating price by state are highly correlated. I recommend reporting the pooled estimates but you can use the simple means if you prefer. I provide columns and graphs for both below.